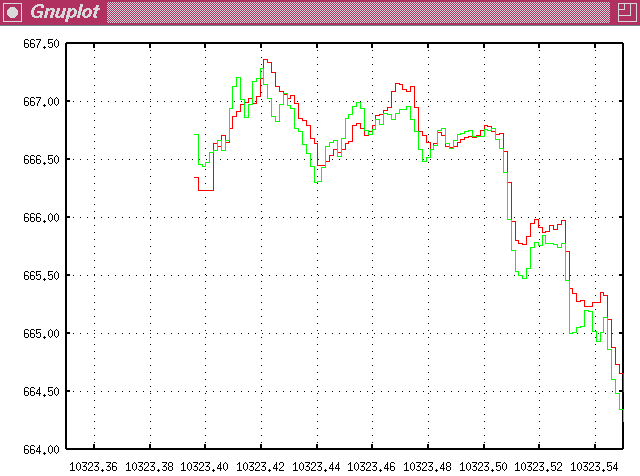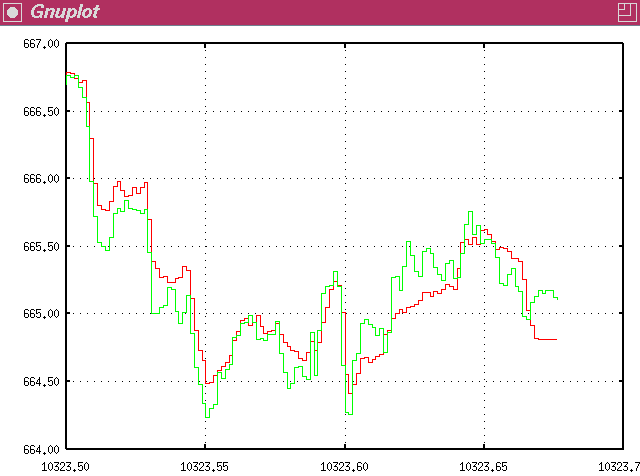
Below are two charts, representing the price history of the S&P 500 at 2-minute intervals, on August 28, 1996. The colors are as follows: red is the "cash" S&P 500 stock index; green is the September 1996 S&P 500 futures price. The futures price is offset by a premium of 0.70 to make the two plots roughly overlap. The vertical axis is price, in units of S&P 500 points.
The plots are split into two half-day panels in order to show the details more clearly, with time measured in "truncated" Julian days. The two panels show the price history over one day, from 09:30 to 16:15 (Eastern time), or 0.39 to 0.68 in fractional days.


The plots show that the futures price tends to lead the cash price by a few minutes, and that the futures are more volatile than cash. Finally, the futures price tends to react more violently to sudden price swings, overshooting the cash price at high and low points.
 Return to COW Homepage
